Instructions
Working with an information tree
Working with diagrams
How to open an existing project?
1. To open an existing project, click File > Open (Figure 1).

Figure 1
How to create a new project?
- To create a new project, click File > New (Figure 1).
- “Project name required” window will appear. Enter a name for a new project, click OK (Figure 2).
- After creating a new project, Science Architect workspace window will open (Figure 3).

Figure 1

Figure 2

Figure 3
How to create a new component?
Adding a folder component (Figure 1)
- Select the folder where you want to add a new folder.
- In the text field enter a name for a new folder, as in this example “The Mediterranean Diet (MD)”.
- Open the list of component types and select the Folder component.
- Click Add.
- Folder has been added.


Figure 1
Adding a statement component (Figure 2)
- Select a folder where you want to add a statement.
- In the text field enter a statement.
- Open the list of component types and select the Statement component.
- Click Add.
- Statement has been added.


Figure 2
Adding a reference component (Figure 3)
- Select a component where you want to add a reference.
- In the text field enter reference information.
- Open the list of component types and select the Reference component.
- Click Add.
- Reference has been added.


Figure 3
Connecting local file to component (Figure 4)
- Select a component which you want to connect to a local file.
- Open the list of component types and select File component.
- Click Select File.
- In File Chooser find and select your wanted file.
- Click Open.
- In Science Architect Click Add.
- Local file has been connected to the component.


Figure 4
Adding a diagram component (Figure 5)
- Select a folder where you want to add a diagram.
- In the text field enter the diagram’s name.
- Open the list of component types and select the Diagram component.
- Click Add.
- Diagram has been added.


Figure 5
How to open a diagram window? (Figure 6)
- In the tree right-click with a mouse on a diagram component.
- Choose Show as Project Diagram from the context menu.
- If the diagram has no elements inside, an empty diagram window will open.


Figure 6
How to work with diagram?
How to create node in a diagram? (Figure 1)
- Make sure that the diagram’s window is opened.
- Select a component in the tree.
- By holding the left mouse button drag the selected component to the diagram’s window.
- Plus symbol, next to the component icon, indicates that the diagram has elements inside.


Figure 1
How to flag node as a problem? (Figure 2)
- In the diagram window right-click with a mouse on a node.
- Select Flag > Problem Flag from the context menu.
- Red color and rounded corners indicate that the node becomes marked as a Problem.


Figure 2
How to create a relation? (Figure 3)
- Select relation from the diagram window toolbar.
- By clicking the left mouse button drag relation from one node to the other node.
- Relation can connect to any port that appears in the target node.

Figure 3
How to create relation bend? (Figure 4)
- Hover mouse on a relation.
- Press the left mouse button, hold it pressed and start dragging it.

Figure 4
How to select diagram elements? (Figure 5)
- Press the left mouse button, hold it pressed and drag it over diagram elements. After finishing, release the left mouse button.
- Diagram elements have been selected.


Figure 5
How to move elements in a diagram? (Figure 6)
- Press the left mouse button, hold it pressed and drag it over diagram elements which you want to move.
- Hover mouse on selected diagram elements, “move” icon will appear. Press the left mouse button, hold it pressed and move diagram elements.


Figure 6
How to move the diagram viewport? (Figure 7)
- Press the right mouse button in the diagram window, “pointing hand” icon will appear.
- Hold it pressed and move it in the direction you want.


Figure 7
Diagram window toolbar overview (Figure 8)

Figure 8
1. Show This Diagram in Tree. Shows opened diagram’s component location in a tree (Figure 1).


Figure 1
2. Show Labels. Shows labels of nodes and relations (Figure 2).


Figure 2
3. Fit to Screen. Fits a viewport with all the elements inside the screen of the diagram (Figure 3).


Figure 3
4. Reset Zoom. Sets viewport zoom to 100% (Figure 4).


Figure 4
5. Hierarchical Layouts. Arranges relations and nodes in hierarchical layouts (Figure 5).


Figure 5
6. Compact Layout. Arrange relations and nodes in a compact layout (Figure 6).


Figure 6
7. Orthogonal Layout. Arranges relations and nodes in orthogonal layout (Figure 7).


Figure 7
8. Relations (Figure 8).

Figure 8
How to check, in which diagrams, tree components are used? (Figure 9)
- Make sure that the Specification tab is selected on.
- In the tree select the component of interest, as in this example “Pancreas cancer”.
- In the Specification tab you can see in which diagrams component is used.

Figure 9
How to zoom in?
Regular Zoom in function (Figure 1)
- Trimmed node edges indicate that there are more elements inside it. Use Zoom in function to see what components are inside.
- In the diagram window right-click with a mouse on a node. Select Zoom in from the context menu.
- Zoom in function opens a new diagram window.
- These nodes are “inside” the node with which we did Zoom in function.


Figure 1
Multiple Zoom in function (Figure 2)
- Select multiple nodes in the diagram window. Trimmed node edges indicate that there are more elements inside it.
- Press right-click with a mouse on one selected node. Select Zoom in from the context menu.
- Zoom in function opens a new diagram window.
- Multiple Zoom in function allow you to see what is inside in both nodes combined. Two diagrams which were selected were merged into one and a new diagram was created.


Figure 2
How to zoom out?
Regular Zoom out function (Figure 1)
- In the diagram window right-click with a mouse on a node, (as in this example on a node “Lycopene”). Select Zoom out from the context menu.
- Zoom out function opens a new diagram window.
- These two nodes indicate that the “Lycopene” node is inside of them.


Figure 1
Construct Knowledge
A Science Architect is capable to construct knowledge (Figure 1) out of existing knowledge automatically. The larger your project the more powerful this feature becomes. If we have a project with several diagrams (the more the better) we can construct knowledge by doing this:
- When the project is opened, make sure that the Filter tab is selected.
- Enter a keyword of interest, as in this example “Lycopene”.
- Click Construct Knowledge.
- Final result is a unique diagram which was automatically constructed for you. This diagram might contain knowledge that was not observed by any human or person. That means that this knew knowledge comes directly from hidden knowledge.


Figure 1
Filtration
Tree Filtration (Figure 1)
- To filter tree make sure that the Filter tab is selected.
- Enter a keyword of interest, as in this example “Diet”.
- Click Filter Tree.
- New filtered tree tab will be created.
- In filtered tree information will be decreased based on your keyword.


Figure 1
How to show filtered diagram? (Figure 2)
Firstly follow steps described in section Tree Filtration
- To open a filtered diagram press right-click with a mouse on a diagram component in a filtered tree. Select Show as Filtered Diagram from the context menu.
- New filtered diagram tab will be created and opened.


Figure 2
Extract filtered diagram (Figure 3)
Firstly follow steps described in section Tree Filtration and How to show filtered diagram
- To extract filtered diagram make sure that filtered diagram is opened and visible (How to show filtered diagram see here).
- Make sure that Project tab is selected.
- In the tree right-click with a mouse on a component (most cases Folder) where you want to add an extracted filtered diagram. Select Extract Filtered Diagram.
- Choose a component type. Recommended Diagram component.
- Extracted Filtered Diagram will be created in the tree, in a selected component (most cases Folder).
- Also Extracted Filtered Diagram will be opened as a new tab on the right.


Figure 3
How to merge diagrams into one?
Merge function (Figure 1) allows to merge multiple diagrams into one. As in this example you can see two separate diagrams “Diagram_1” and “Diagram_2”.


To merge “Diagram_1” and “Diagram_2” into one you need to:
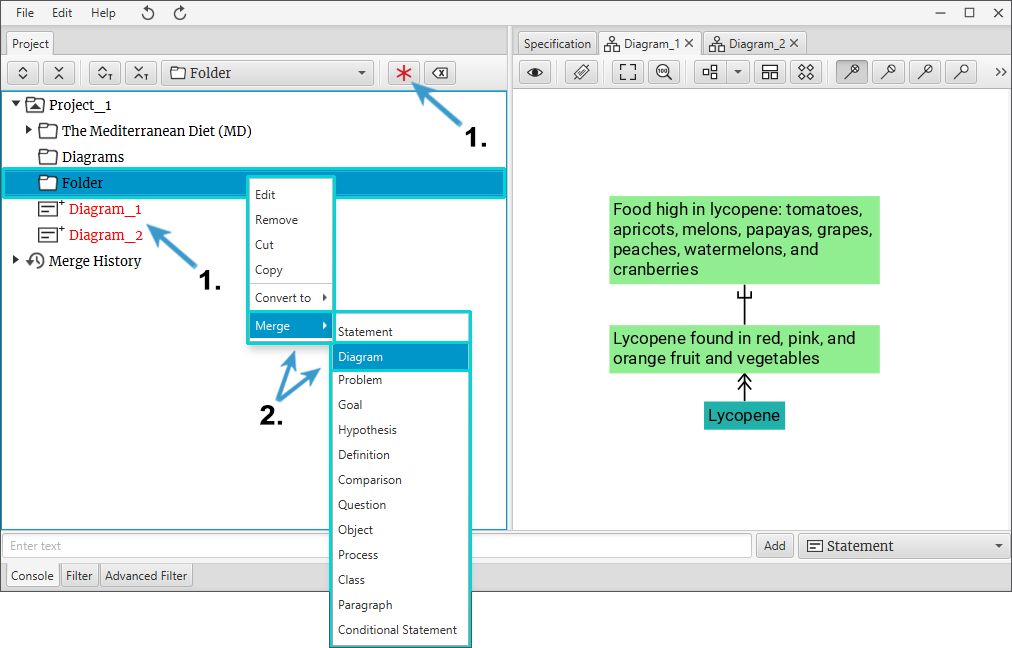
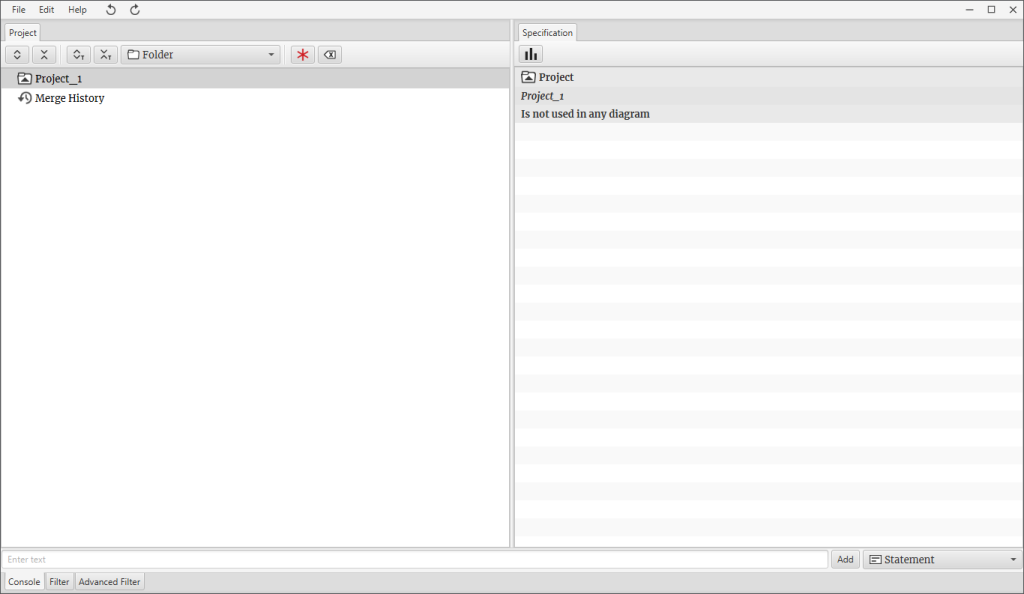
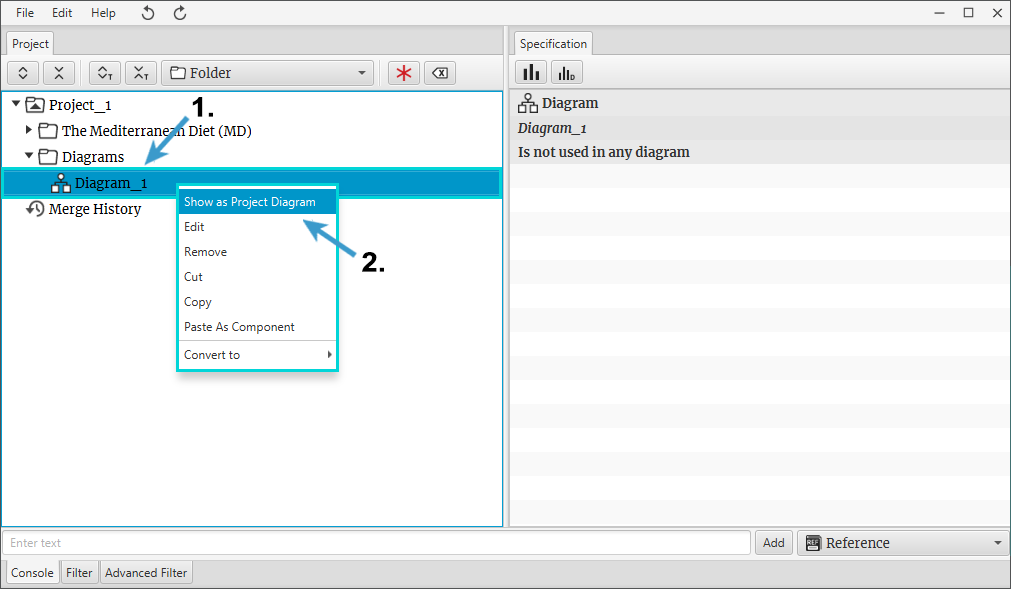
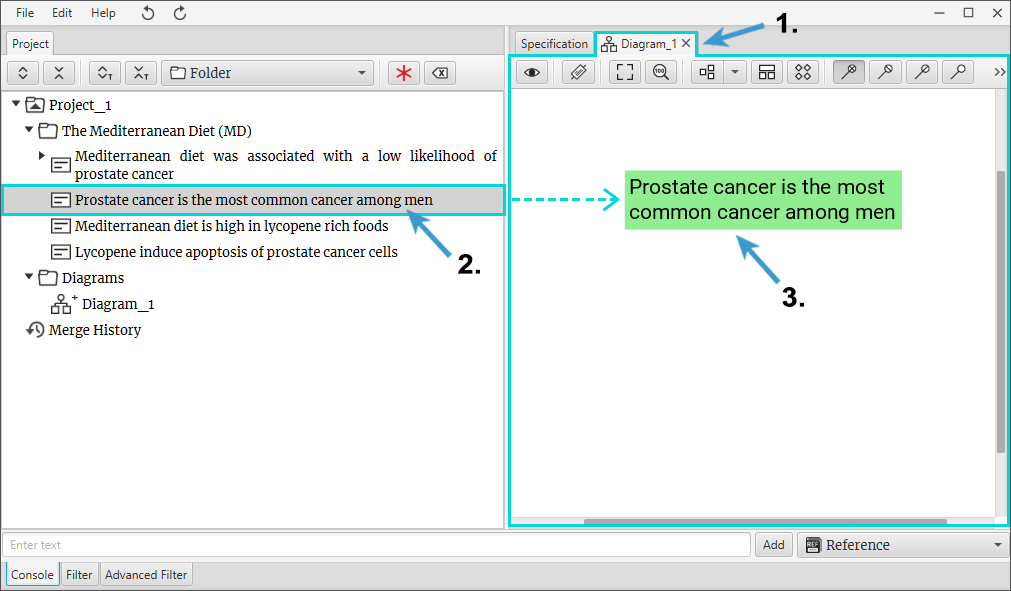
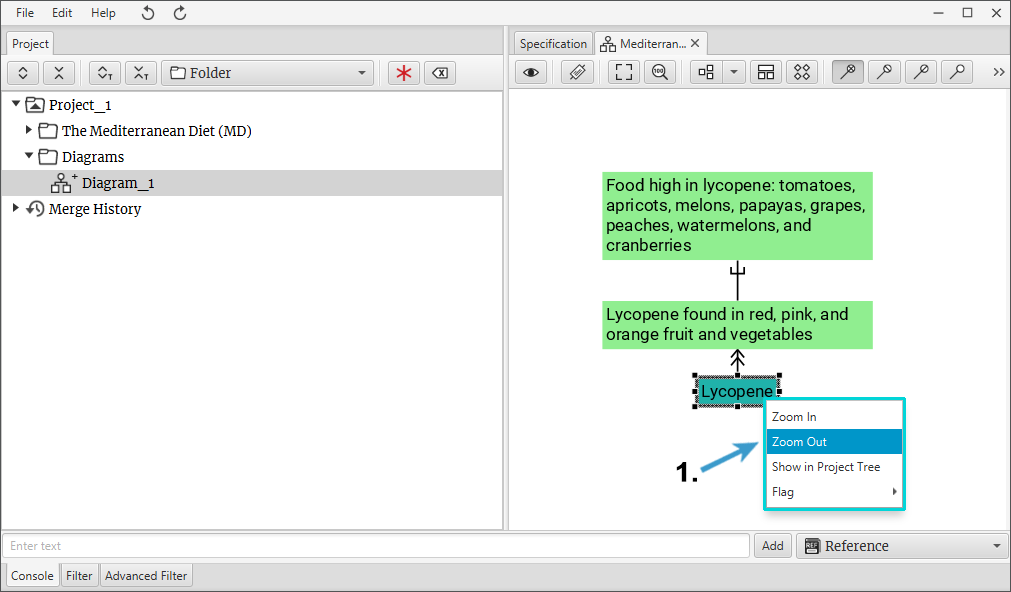
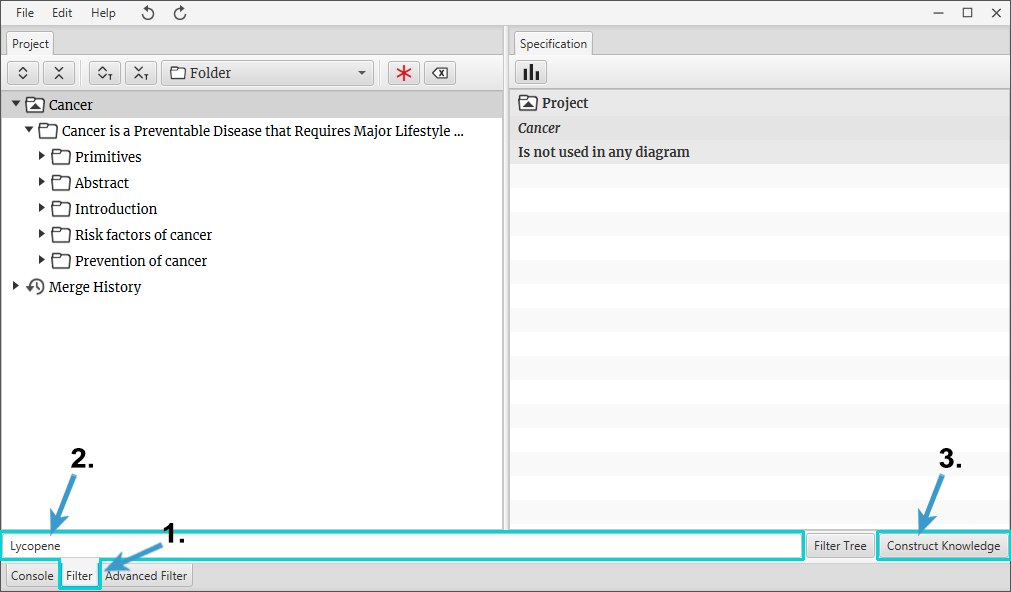
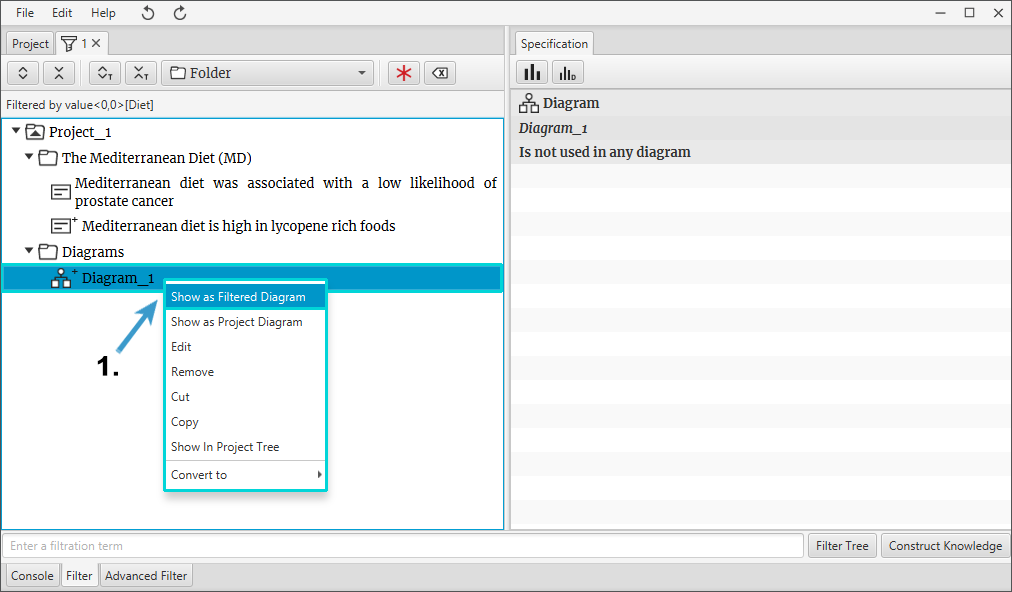
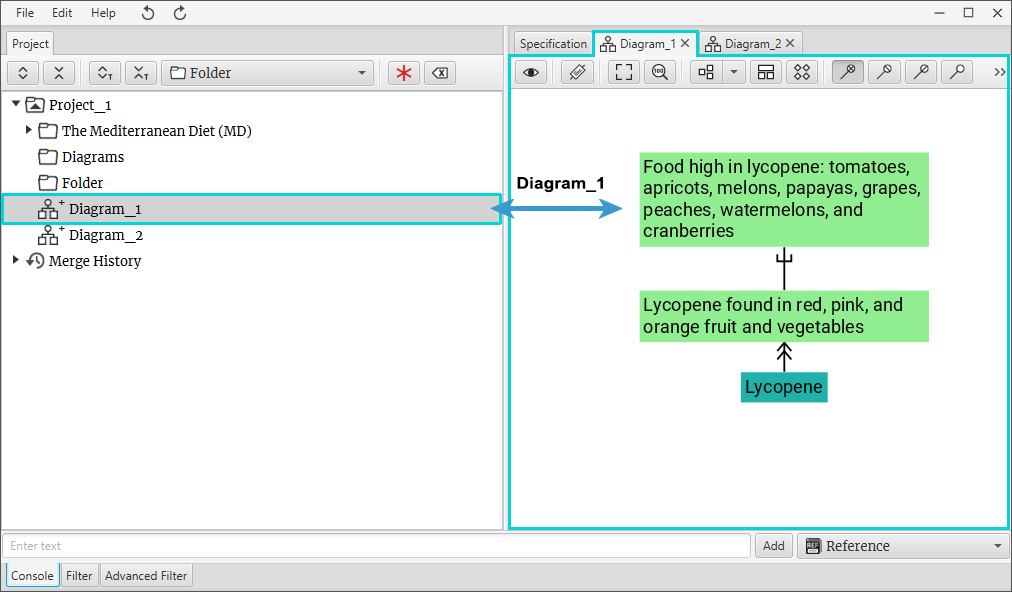
- In a tree left-click with a mouse on a component (most cases Diagrams) which you want to merge. Mark it with Mark Component tool
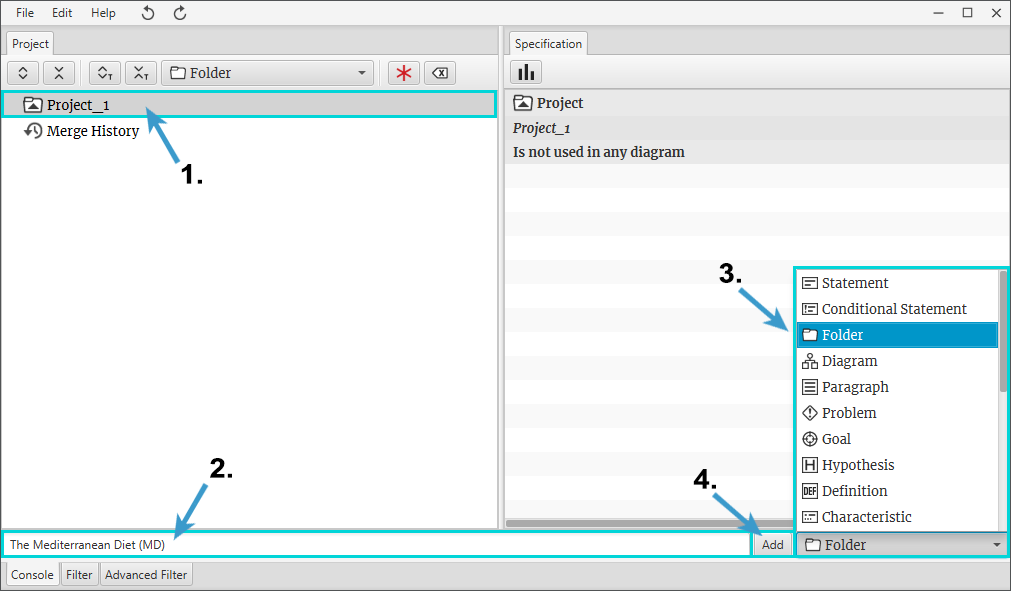
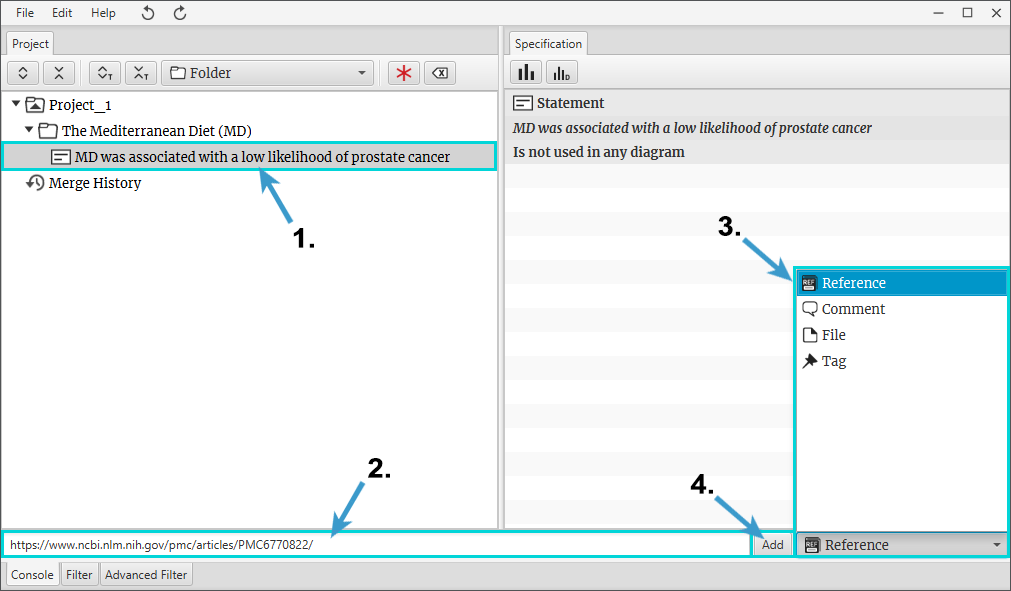
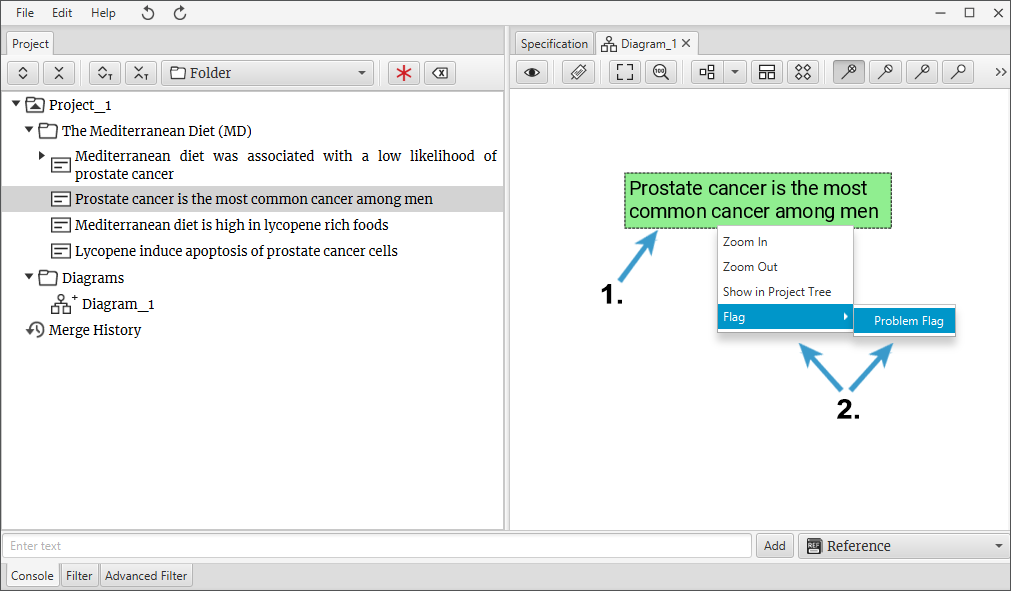
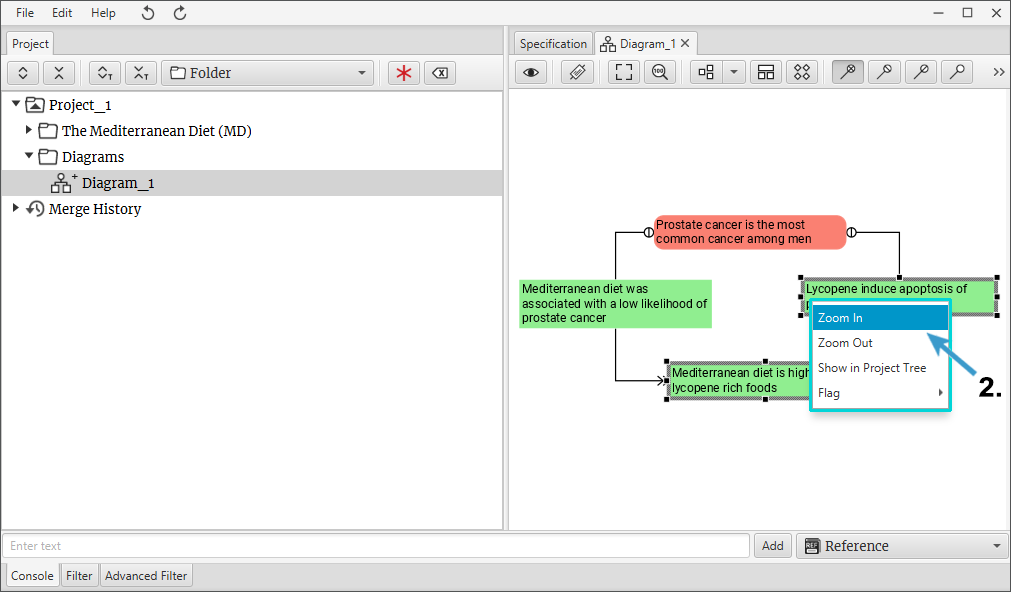
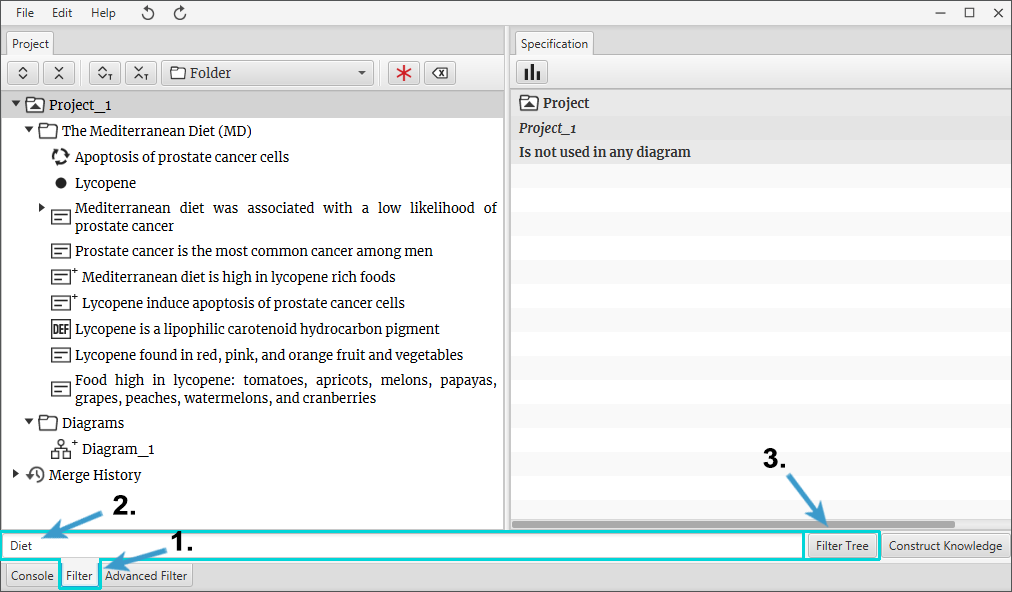
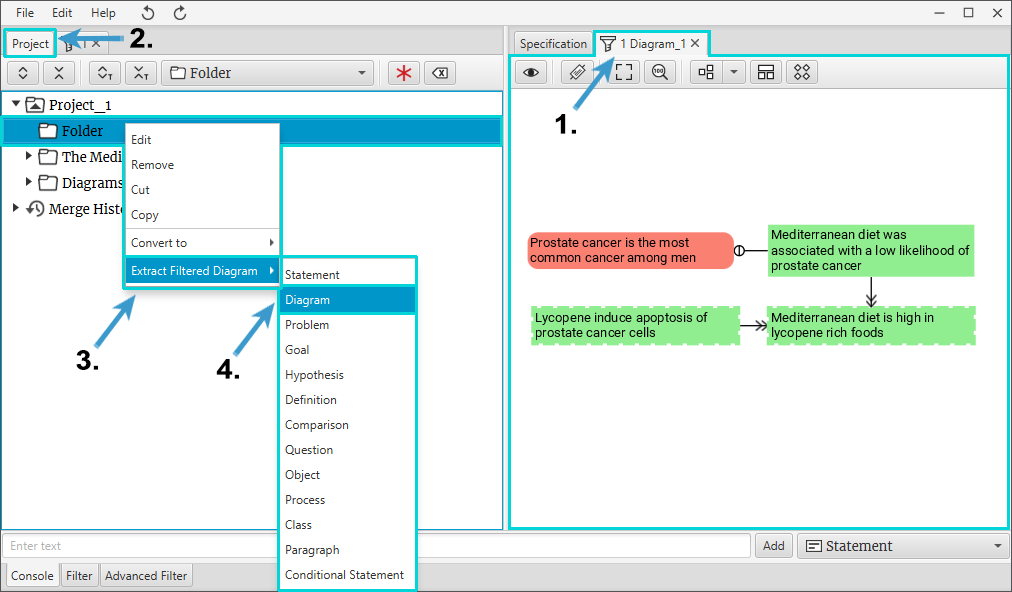
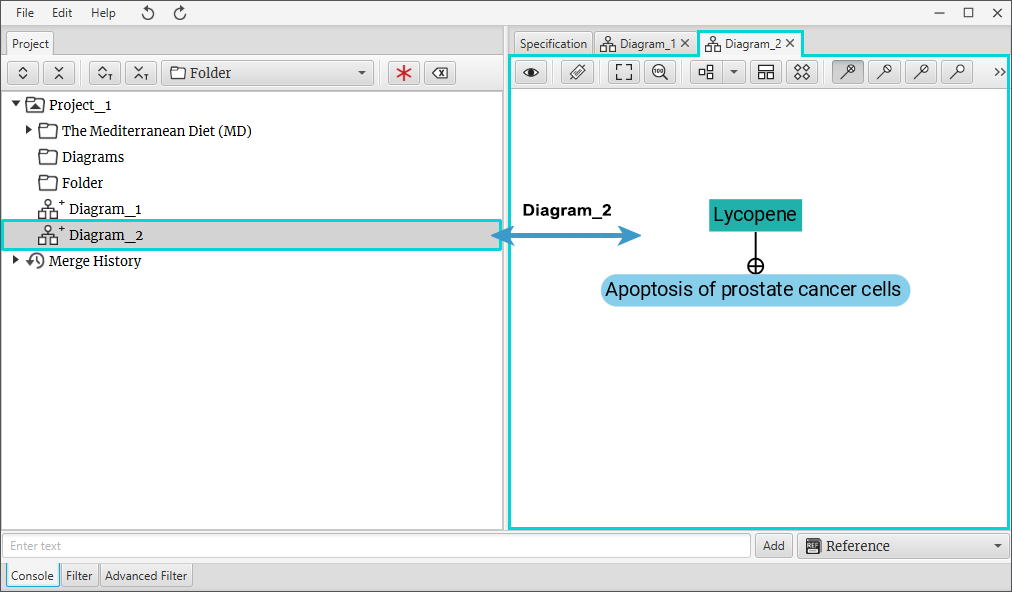
**.
- Select a component (most cases Folder) where you want a merged diagram to be added. Right-click on it with a mouse and select Merge > Diagram from the context menu.
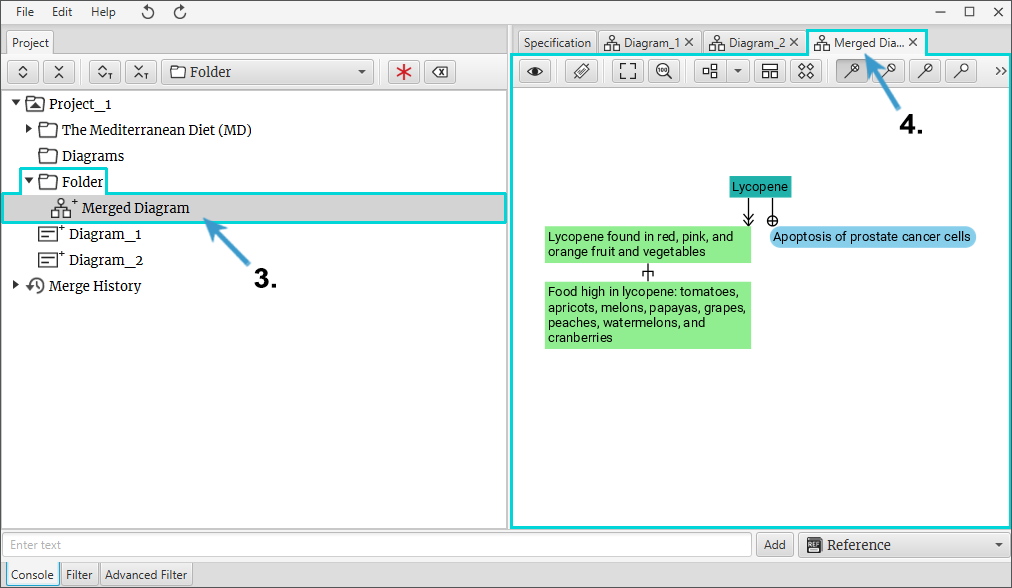
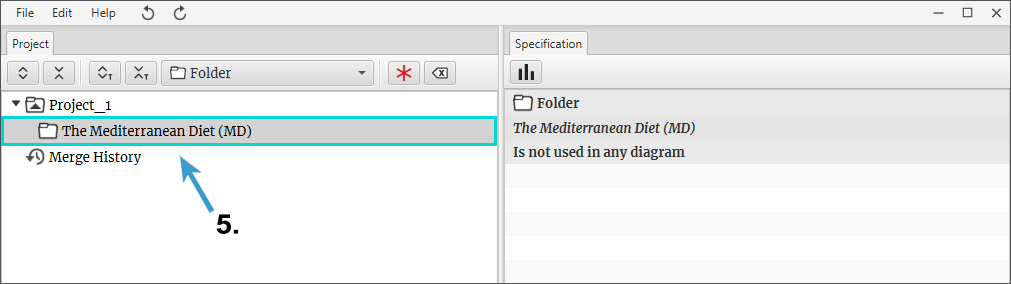
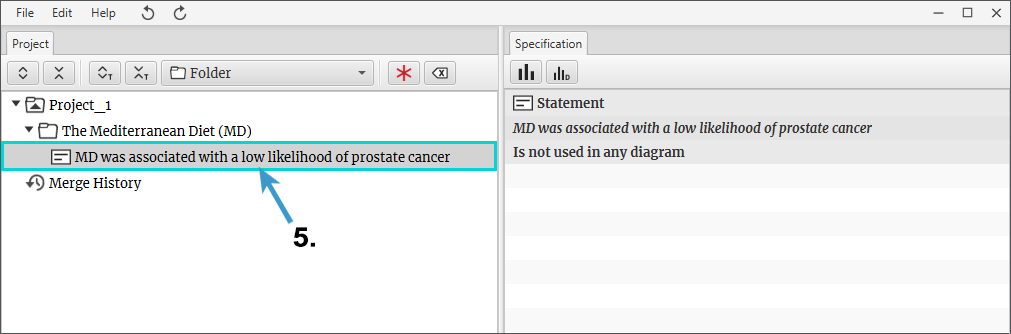
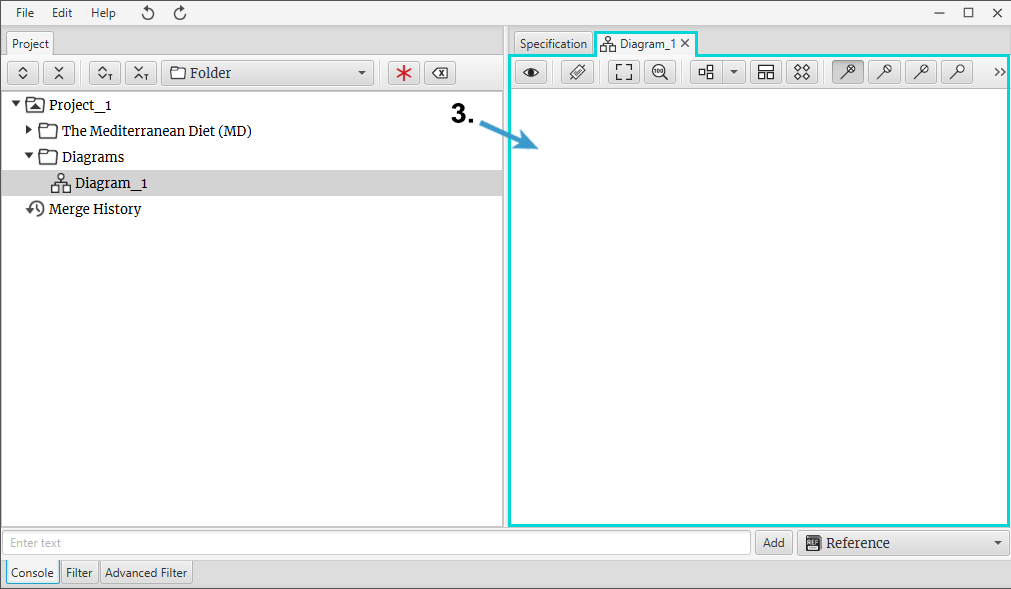
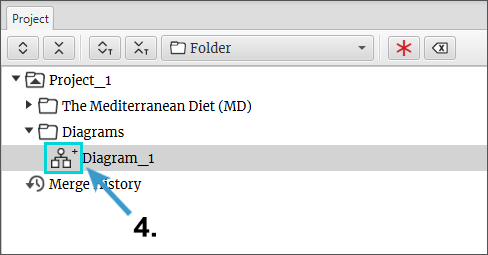
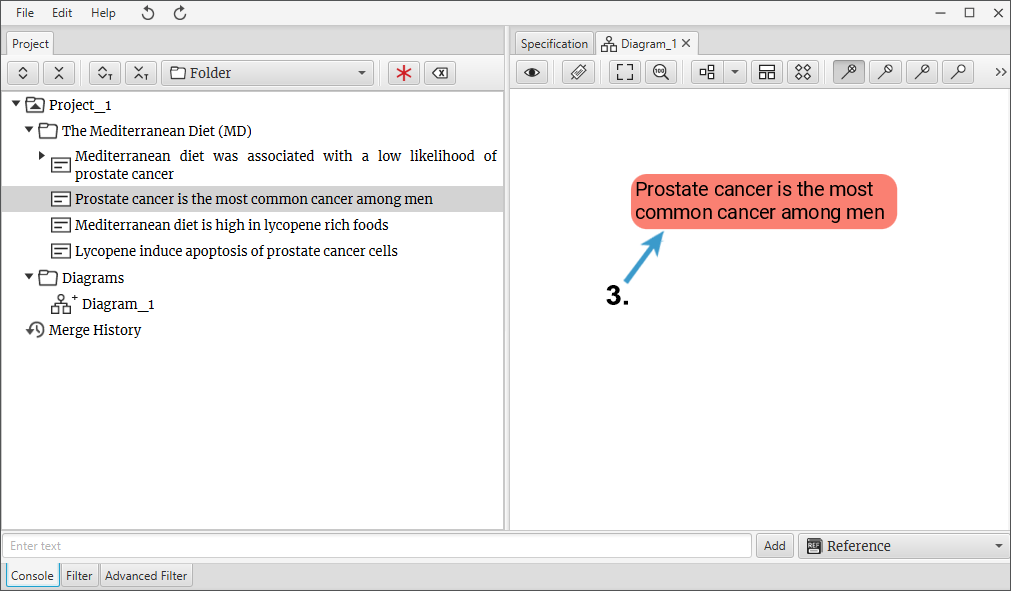
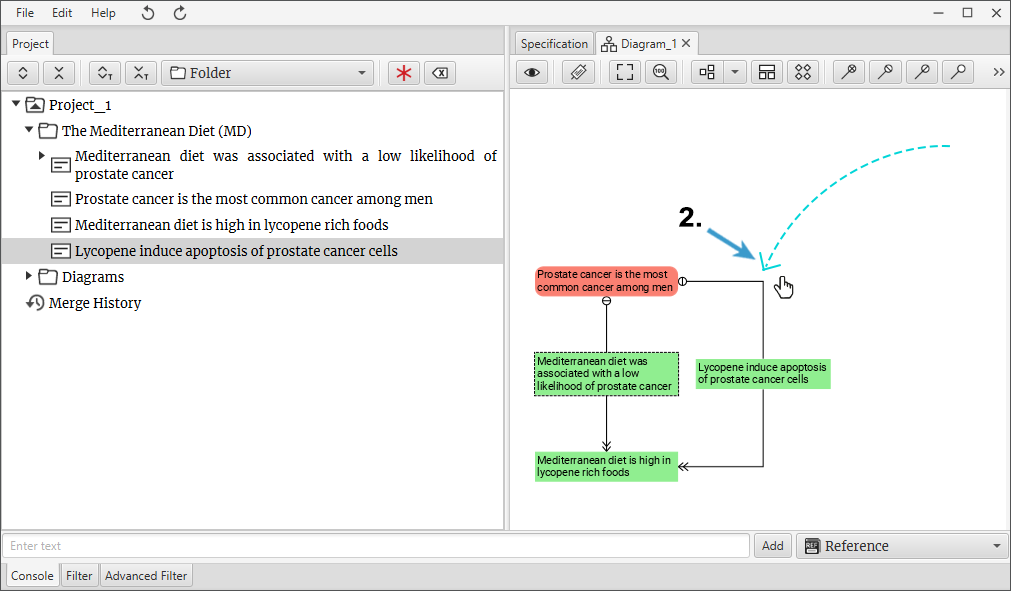
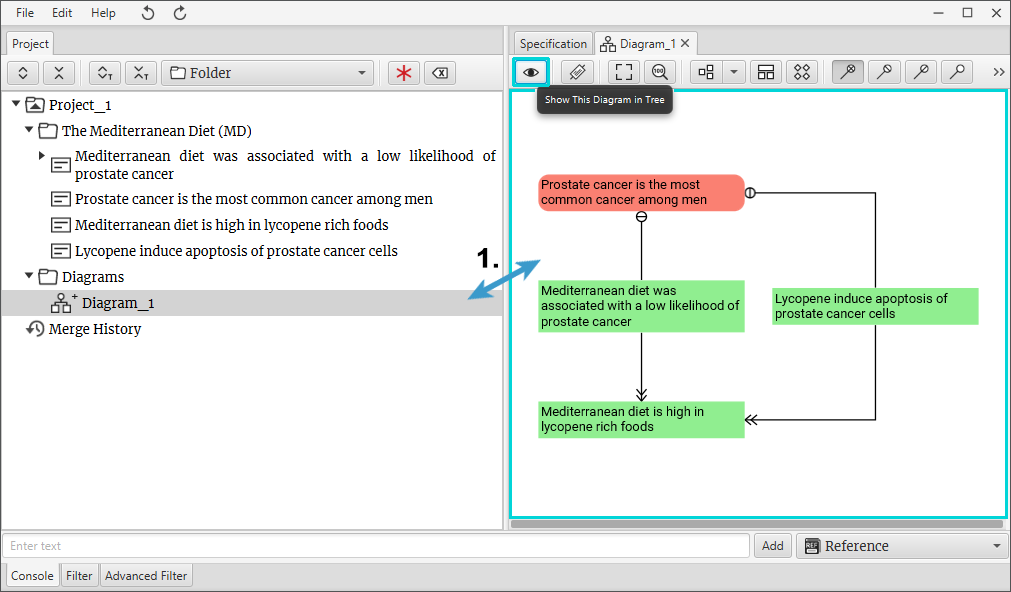
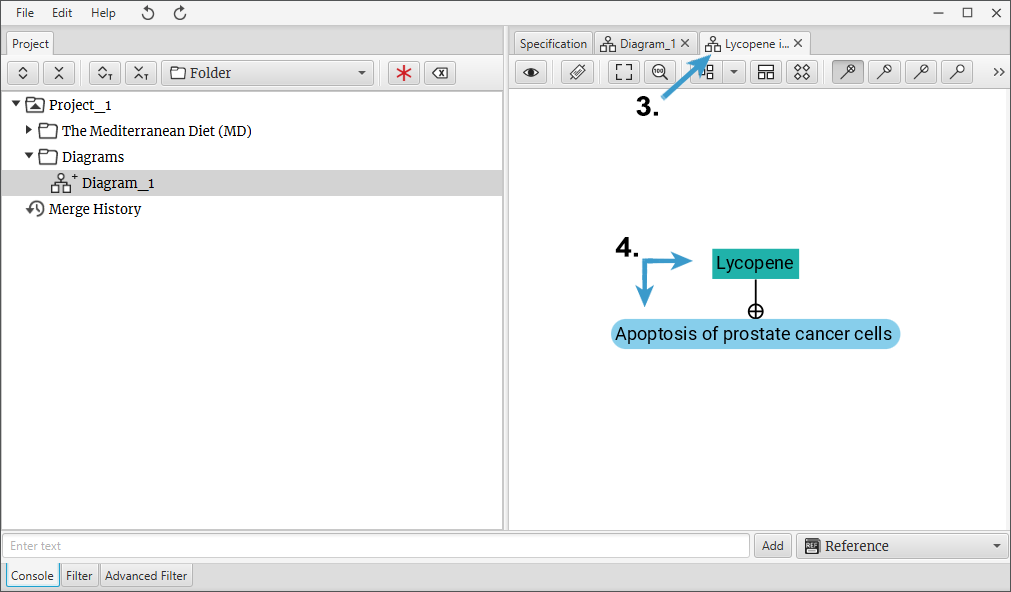
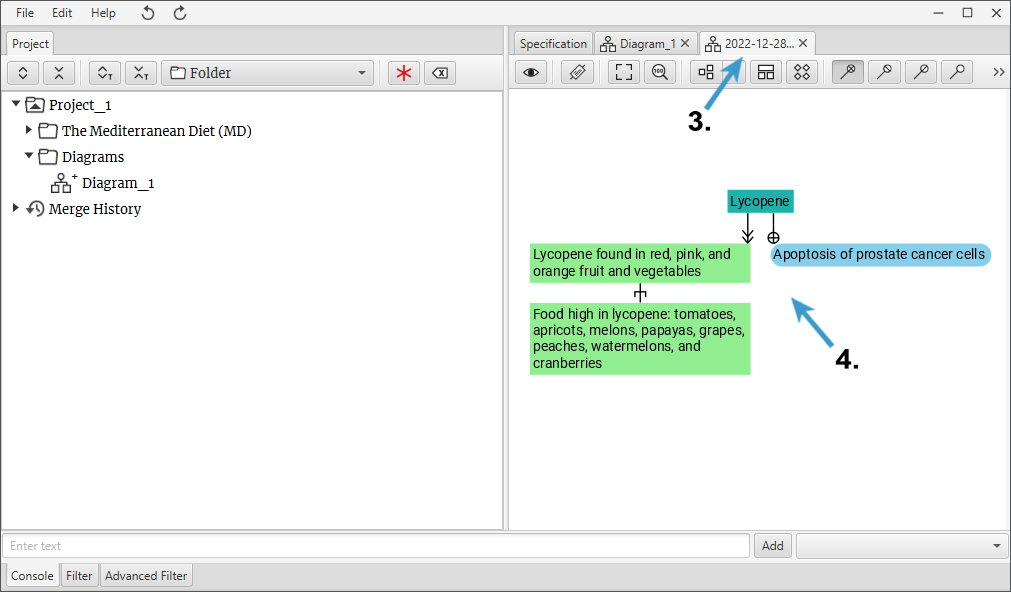
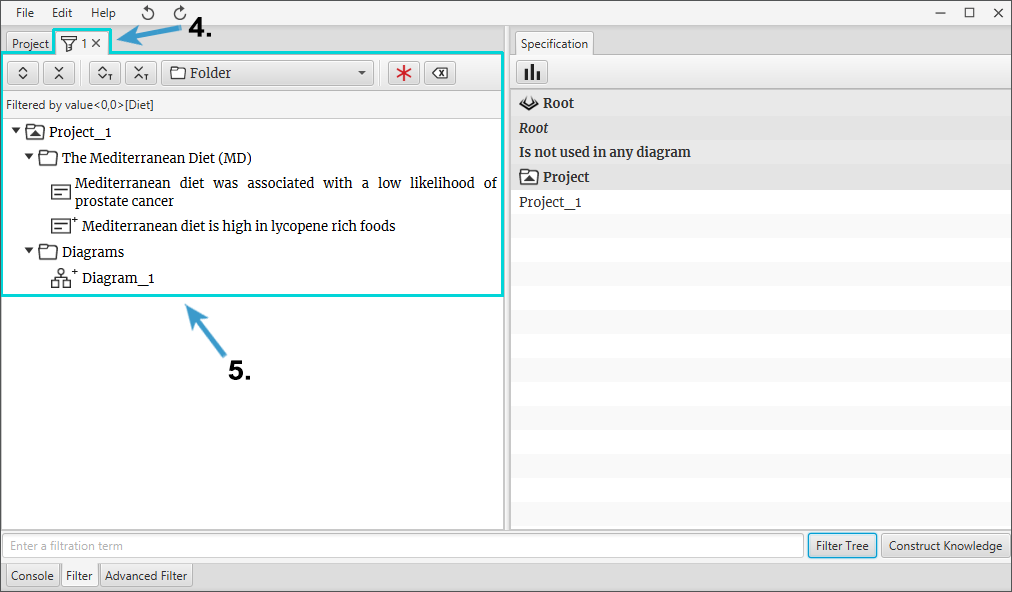
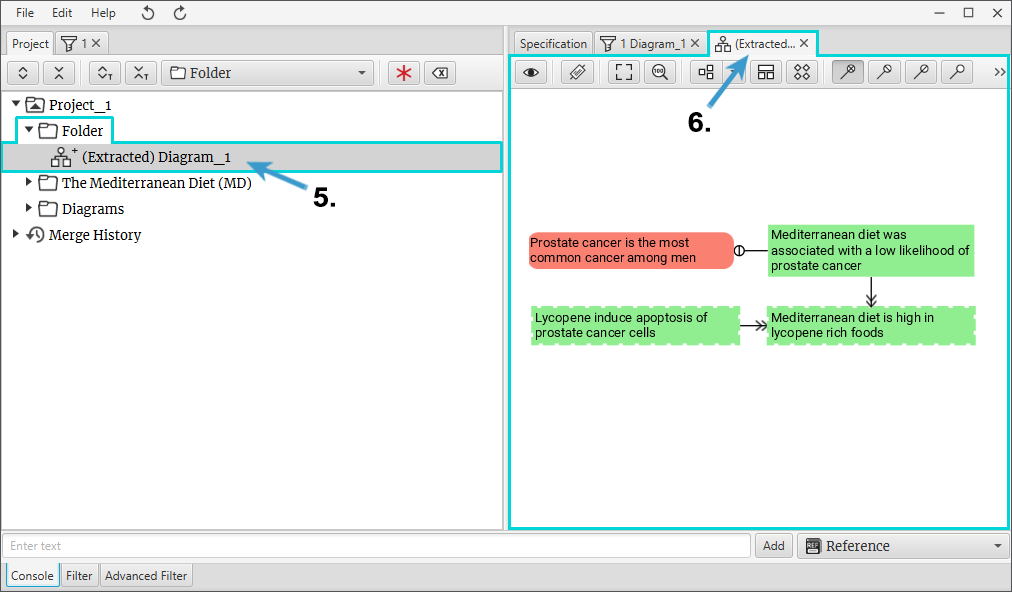
- Merged Diagram will be created in the tree, in a selected component (most cases Folder).
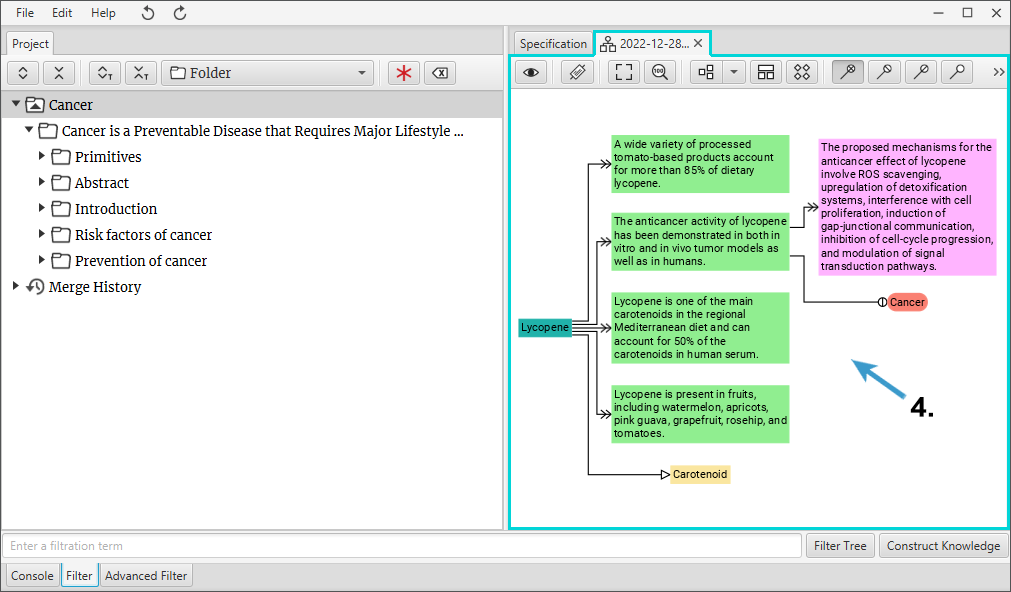
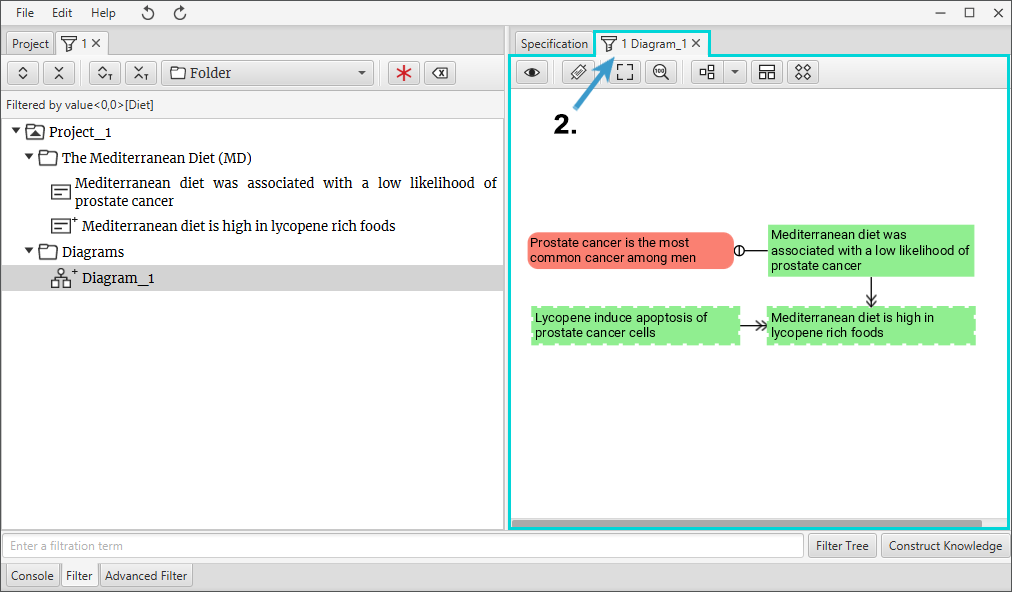
- Also Merged Diagram will be opened as a new tab on the right.
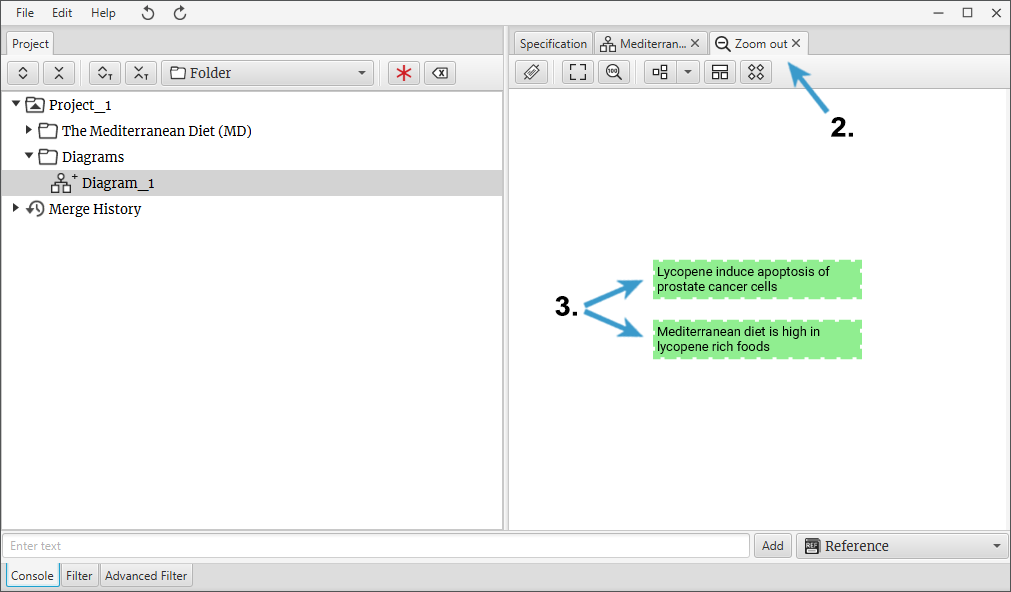
** To unmark it click Clear Marked Components


Figure 1
How to save a project?
- If the project has been saved before, option Save will save the project on top of the existing project. If the project has not been saved before (new project), option Save allows you to choose where you want to save the project.
- Option Save As creates a new copy of the project and lets you choose where you want to save the project.

How to close a project or Science Architect program?
- To close a project, click File > Close
- To quit the Science Architect program, click File > Quit
